

Edwin Díaz was supposed to be the best reliever in baseball.
When Brodie Van Wagenen made the now-infamous trade in December for Díaz and Robinson Canó, giving up prospects in the process, many marketed it as a trade exclusively for Díaz, a young, cost-controlled superstar who took the league by storm in 2018 with a season bordering on the absurd. He wasn’t just the best reliever in baseball – he was maybe the best reliever baseball had seen in a decade:
- His 57 saves were by far the most in baseball (2nd-place Wade Davis had 43), and the most in a season for any reliever since 2008
- His 1.61 FIP (Fielding Independent Pitching) was the best among relievers with at least 30 innings pitched, and 6th-best in a 3-year span
- His 3.5 WAR (Wins Above Replacement) ranked 2nd for a reliever in a single season since 2005
Of course, these trends – how should I say this – didn’t continue in 2019.
- His 25 saves are 14 fewer than the current MLB leader
- His 4.37 FIP currently ranks 124th among relievers with at least 30 innings pitched
- His 0.2 WAR ranks 138th among relievers with at least 30 innings pitched
Some people will of course ascribe this to a Mets curse, but even with superstition aside, the Mets have both been an excellent pitching team this season (and have been able to develop a star reliever) and greatly increased the value of players they traded for in the offseason.
In my opinion, his struggles this season boil down to one big reason: he’s being hit harder. A lot harder.
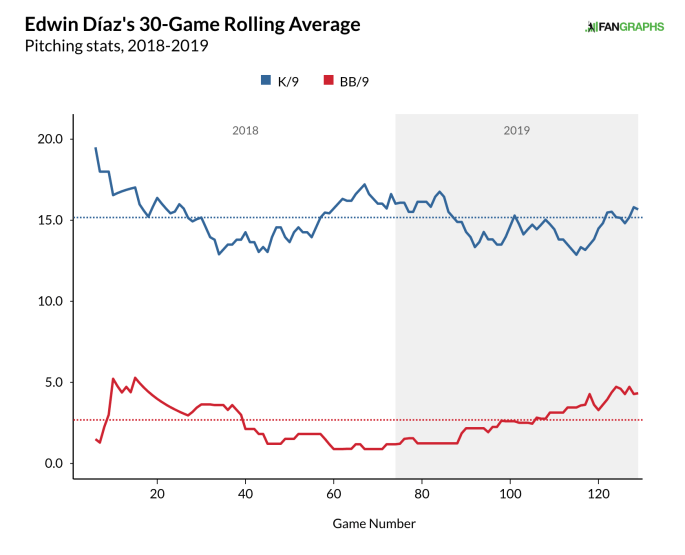
Sure, his walks have ticked up this year, but not by much, and his strikeouts have pretty much remained the same:
Most of his StatCast peripherals have remained elite, too. In 2019, his fastball velocity is in the 97th percentile, and his strikeout percentage the 99th percentile. A quick glance at his rankings is very intriguing – he’s been just as amazing as last year in many ways, but his exit velocity and hard hit percentage allowed have tanked this year:


Charting his rolling FIP paints an absolutely brutal picture, but shows an amazing discovery – it’s correlated almost entirely with his home runs allowed per nine innings, and strikingly so:
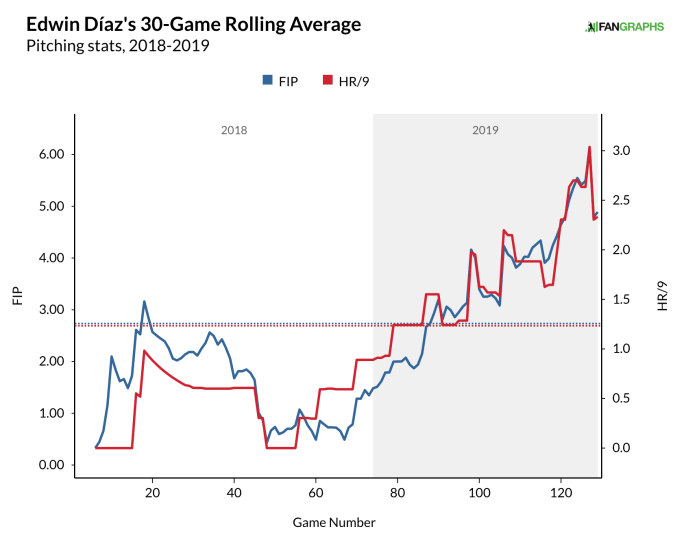
As a matter of fact, the correlation between these rolling statistics since August 9th, 2018, where the enormous upward trend begins, is a mind-blowing 97.2%. You don’t have to be a statistician to realize there’s a pretty serious relationship between Díaz’s ability to prevent home runs and his overall effectiveness.
There’s an interesting tidbit here, though – notice the upward trend starts before the end of last season; his struggles actually appear to have begun in late 2018 and continued unimpeded, but unaccelerated, in 2019. Maybe a little feather in the Mets’ cap is that they don’t appear to have caused these issues (but, on the other hand, they did agree to trade for him when this trend had already begun).
Hammering in this point is the following chart of his hard/medium/soft hit percentages, which begin to trend in the wrong directions in the final third of 2018, and actually seem to stay remarkably consistent in 2019, perhaps even improving across the season:

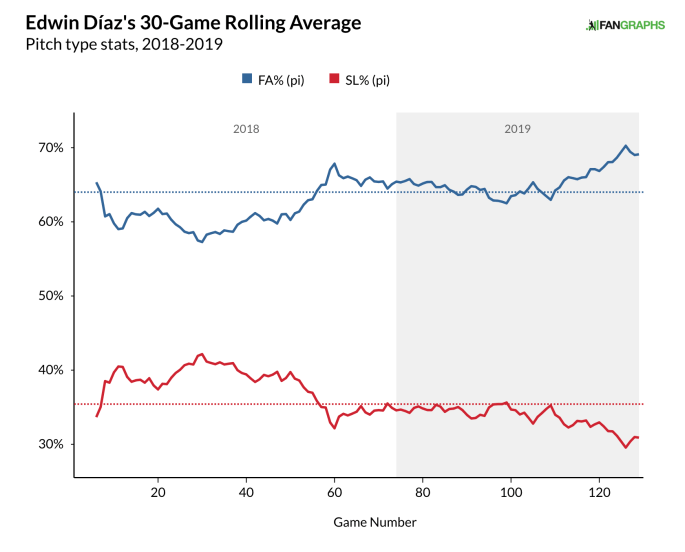
One trend you can see changing over the course of 2019, though, is the loss of confidence in his slider. I’m not the first to mention the fact something is up with Díaz’s slider this year, but he’s clearly been relying more on his fastball as the year has gone on:
Here’s an interesting visual Baseball Savant provides to show this lack of confidence – a chart of his share of pitch choice by count. 2018 is on the left, 2019 on the right:


The little pie charts show how often Díaz used his slider at a specific point in the count. For example, you can see that in 2018 (left) he threw his slider almost half the time on 1-2 counts, as evidenced by his 1-2 pie half yellow and half red. In 2019, though, he’s only thrown his slider on 1-2 about a quarter of the time. 1-2, of course, is a count where you really want to give the batter your finishing blow. It seems this season he doesn’t want to; you can see the same thing with his 2-2 counts.
Where I think the confidence really shows through is in 3-2 and 3-0 counts – counts where if Díaz fails, it’s a walk. Last season, he threw his slider more than half the time on 3-2 counts, and even threw them sometimes at 3-0, clearly knowing that even if he misses the zone, he could fool the batter. This year, though, he’s significantly dialed back his slider usage in full counts to about a third of the time, and hasn’t thrown them on 3-0 at all.
It’s hard to even tell what’s different about his slider this year, other than the facts that he isn’t throwing it as often (33.6% of his pitches in 2019; 37.3% in 2018) and it isn’t working as well. These StatCast visuals show he’s thrown the slider just has hard this year (harder; 89.3 mph to 89.1 last year):


Dig a little deeper, though, and you can see that although the velocity hasn’t worsened, the break has (2018 left; 2019 right):


Okay, that really doesn’t look like much, but bear with me here. The yellow oval (representing sliders) has moved slightly up and to the left. In this case, his slider had an average vertical break of -29.6 inches in 2018, with an average horizontal break of 1.5 inches. In 2019, those numbers are -28.3″ and 1.4″. Such a small-seeming change, though, can be astronomically important in baseball. Think of it this way: his slider is breaking 1.3 inches fewer on average this year than last year. When you consider a regulation baseball bat is only 2.6 inches in diameter, that becomes a whole lot more striking – that half-bat is the difference between a weak infield pop up and a 400-foot home run right on the barrel.
Take a look at this slider from 2018:
And this one in 2019:
Another view comes from the below swing heat maps for batting average against his slider in each year. In 2018, no one was touching it. There are 17 zones where the opponents’ batting average is literally zero. This year, there are only 9 such zones, both because he isn’t coaxing as many swings in the non-strike zones (boxes remain black if the minimum of 3 swings in that zone hasn’t been met), and because he’s giving up hits in the zones he hadn’t given up hits in last year:


Tying this back to the home run issue, it seems like when Díaz has given up really bad contact, it’s been when he’s struggled to keep the ball on the outside part of the zone to hitters (sliders break away from righties). He’s given up 12 home runs this year, and they’ve been pretty clearly split in left field and right field:
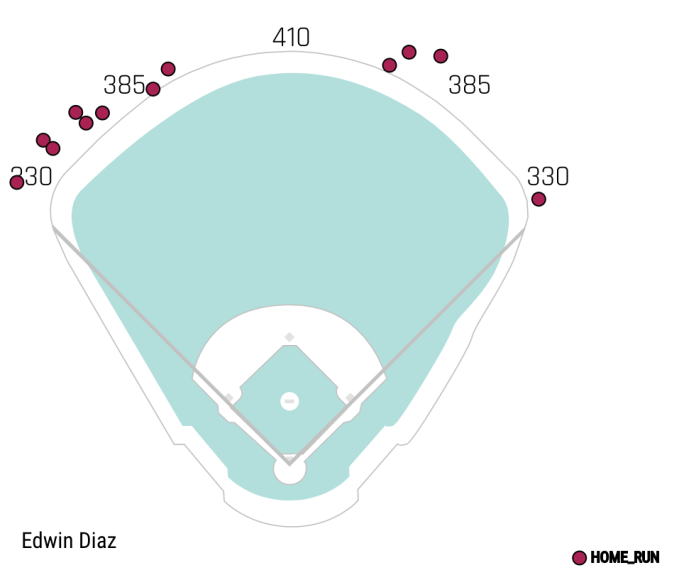
The 8 home runs to left field:
- José Iglesias (righty)
- José Osuna (righty)
- Victor Robles (righty)
- Starling Marte (righty)
- Mitch Garver (righty)
- Jean Segura (righty)
- Leury Garcia (switch)
- Maikel Franco (righty)
The 4 to right field:
- Joc Pederson (lefty)
- Freddie Freeman (lefty)
- Jesse Winker (lefty)
- Max Muncy (lefty)
This isn’t insane considering most hitters have more power to their pull side, but I think it’s a very interesting trend that can be viewed both positively and negatively – when Díaz does keep the ball away from hitters, they have a ton of trouble hitting home runs, but he just hasn’t been able to do it enough.
These problems all tie together, and the Mets of course have plenty of people, from pitching guru Phil Regan to ace Jacob deGrom, on the case. His hard contact and slider break issues are both very serious, don’t get me wrong there, as Díaz will probably never be the elite reliever he once was ever again if the issues persist. However, the fact that his problems are so clear in their diagnosis lends to optimism. The right tweak in form or mentality could cause the entire package to fall into place – it’s no wonder smart teams like the Red Sox and Astros were hoping to get their hands on him this past trade deadline despite his struggles.
Díaz is under Mets control until 2023, and he is still just 25 years old. The Mets need to have patience with him – you can’t teach his talent, but the things you can teach are the same things ailing him.
by Derek Reifer, Northwestern University
This post can also be found on MetsMerizedOnline.com
