

The Houston Rockets have had a tough start to their season at 0-3, and haven’t been all that impressive in any of the games. Is it a huge cause for concern?
To find out, I first looked at data for all the teams that started 0-3 since 2010. In that span, 17 of the 23 teams that started 0-3 missed the playoffs, and 21 of those 23 teams didn’t make it past the first round. PANIC!
Actually, don’t just yet. That’s too simple a correlation – 0-3 teams are more likely to miss the playoffs simply because bad teams are both likelier than good teams to start 0-3 and likelier than good teams to miss the playoffs. I did a deeper analysis in the statistical programming language R to find out more. For each team that started 0-3 at least once within the past five seasons, I performed a regression model to find the relationship(s) between winning percentage in a season and a multitude of factors: year, team, whether it was a lockout season, winning percentage the previous year, and whether the team started 0-3 that season.
Of those factors, only one was considered statistically significant, i.e., statistical hypothesis testing of the data confirmed with high confidence that the specific predictor has an effect on the result. This significance is measured by “p-value,” which is effectively the percent chance that a predictor doesn’t have a significant effect on the result. Normally in statistics, a p-value below 0.05 (or a 95% confidence of significant effect on the result) is considered the threshold for significance. In the full model, the only significant factor was winning percentage the previous season. Here’s a look at a more simplified model including just the previous winning percentage and whether the season started 0-3 as predictors:
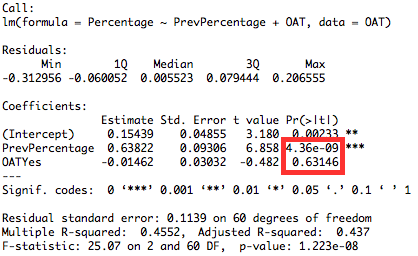
There are a lot of numbers on that program output – if you’re not familiar with R, the most important ones are the p-values found in the red box (the first p-value represents that of the y-intercept for a graph of this relationship as a line or curve on cartesian coordinates). Previous percentage has a p-value of 4.36e-09, which is scientific notation for 0.00000000436 – the designated percentage chance that that predictor doesn’t have a significant effect on the result. As you can see, this p-value has three asterisks to its right, meaning that it is extremely statistically significant. The p-value for whether or not the team started the season 0-3 (abbreviated OAT for 0 and 3) is extremely large and does not receive an asterisk medal.
What about the eye test? The Rockets’ best player, James Harden, has had a rough few games, but could easily have been MVP last season. The Beard put on a truly remarkable campaign, as evidenced by his league standing in multiple statistics:
| First in NBA | Second | Third |
| Minutes | Offensive win shares | Field goals |
| Free throws | Value over replacement player | Steals |
| Free throw attempts | nERD | Box plus-minus |
| Points | Real plus-minus | |
| Win shares | CornerThree wins above replacement | |
| Offensive real plus-minus | ||
| ESPN wins above replacement | ||
| Value added | ||
| Estimated wins added | ||
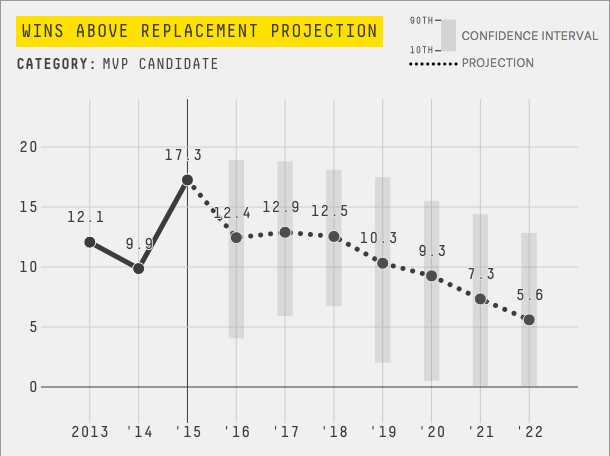
Harden is clearly one of the top players in the NBA, and maybe even the best. Does three games change that? FiveThirtyEight’s CARMELO projection system gives him an expected value this season of 12.4 wins above replacement, which looks like a stark decline, but still would have been top ten in the NBA last season. The 10th percentile of the projection (the bottom of that grey box; effectively the worst-case scenario) would put him around Andre Iguodala’s 2014-2015 season, per ESPN’s Real Plus Minus, in terms of contribution. Not a trade the Rockets would make, but Iggy did of course win Finals MVP last season.
With 79 games remaining, The Beard should even things out.
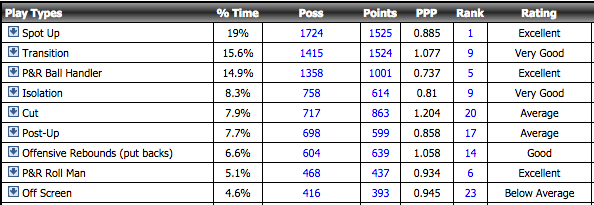
Where is Houston struggling as a unit? According to Synergy Sports data, they only rank below average offensively thus far (by points per possession) in two categories – isolation and pick-and-roll ball handling, which coincide with the growing pains of two ball-dominant guards in Ty Lawson and James Harden in the season’s first three games.
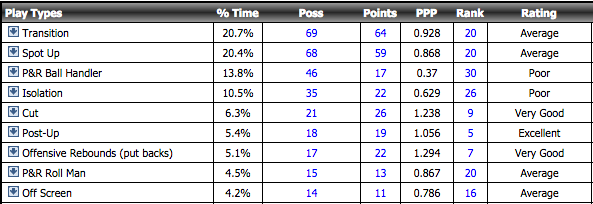
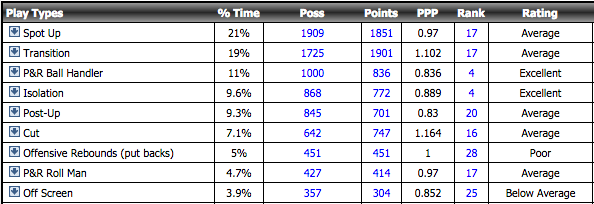
However, those were their two most successful offensive play types over the course of last season, both ranking Excellent at fourth in the NBA.
This year they’ve faced more spot ups than anything else defensively, 19% of the time, and have been below average (24th in the NBA) at defending them in the small sample.
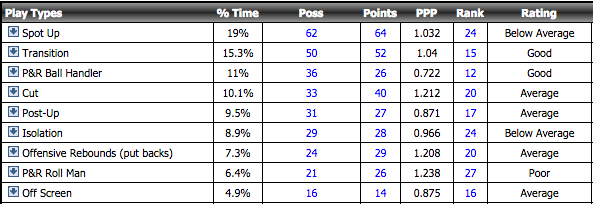
Over the course of last season, they ranked best in the NBA at defending the spot up.
The Rockets are going through some growing pains. Ty Lawson and Harden need to learn to work together. Rotations are far from set as coach Kevin McHale still learns how best to utilize his players. Dwight Howard and Patrick Beverley, two of the team’s best defensive players, figure to see the court a whole lot more than they did last season after struggling with injuries. Moreover, the team’s biggest weaknesses through the tiny sample of three games coincide with their biggest strengths from last season. The Rockets should be able to play to the gameplan and identity they had last year, while slowly but surely integrating their new pieces into the system. Sure, there’s a chance Houston collapses this year, just as there’s a chance the Cavs or Warriors do, but even with an 0-3 start (and a tough matchup tonight against Oklahoma City), there is no significant evidence to predict, or even suggest, such a drastic result.
by Derek Reifer, Northwestern University
