
“Hit it where they ain’t.”
Or so said Willie Keeler in 1904, his 7th straight season with a batting average over .360. Ever since, it’s been a classic adage for baseball, one of the, well, strangest games people play worldwide.
Football, Basketball, Soccer, Hockey… all are pretty similar when you boil things down. One team’s offense has possession of the ball (or other object), and their goal is to get that ball into the other team’s… well… goal.
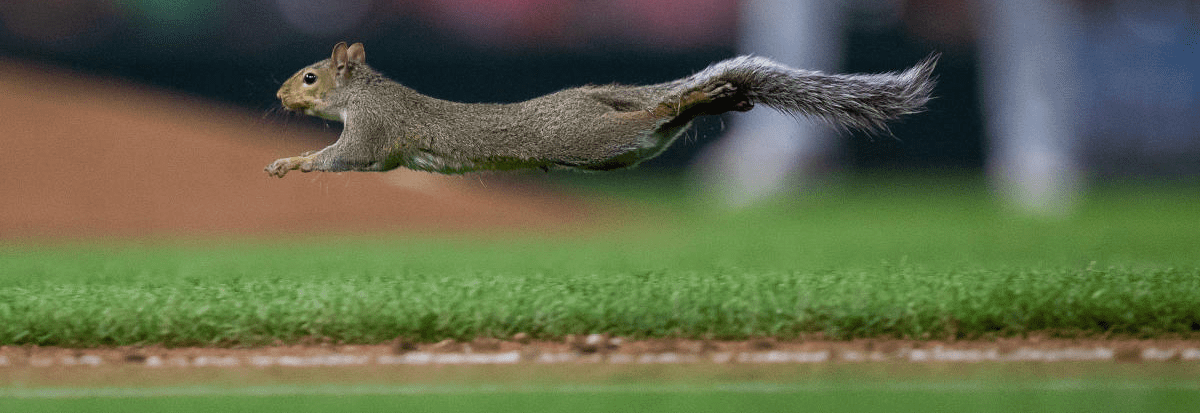
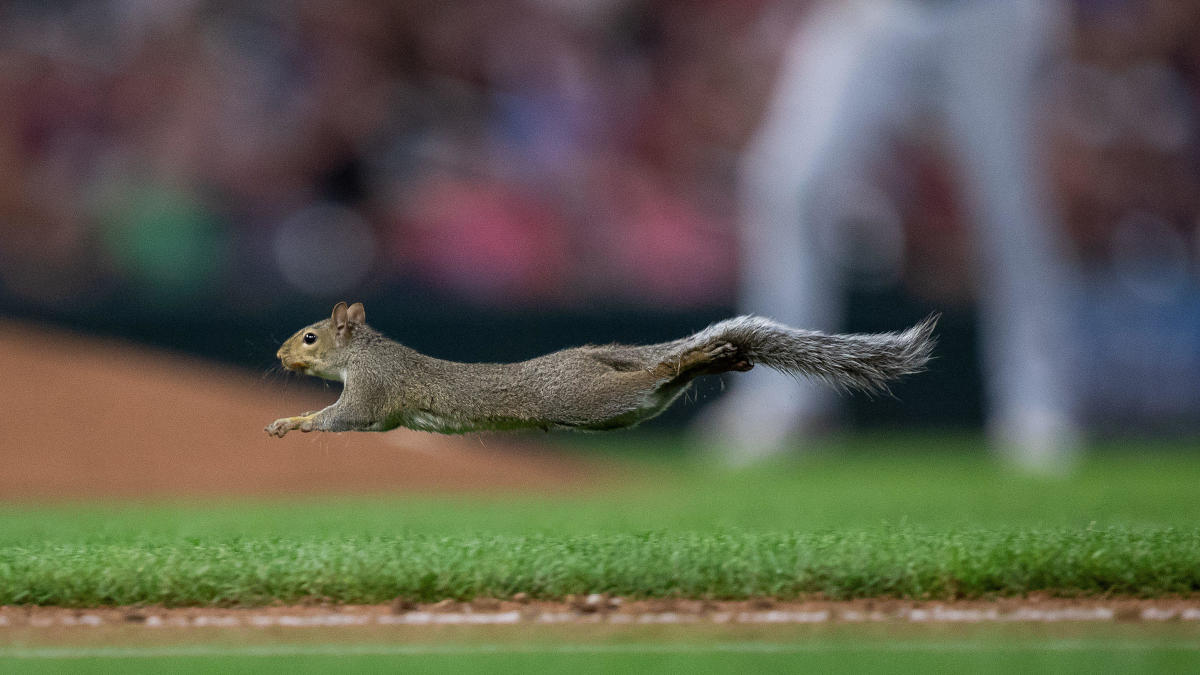
In baseball, though, the defense has the ball. And sure, you can hit a home run, but most of the time, the entire field of play acts like a goal – the more the offense can get the ball to touch the field of play before the opponent, the more that offense is going to score. It’s a large, spacious field of play, too, with plenty of room to run around, as this Minnesota squirrel can attest.
This massive “goal” allows baseball so much more room for weird things – baseball things – to happen during a given game. In a game where swinging and missing at the ball entirely is actually better than hitting that ball really hard but too high up into the air, there will always be lots of room for good old luck alongside, of course, skill.
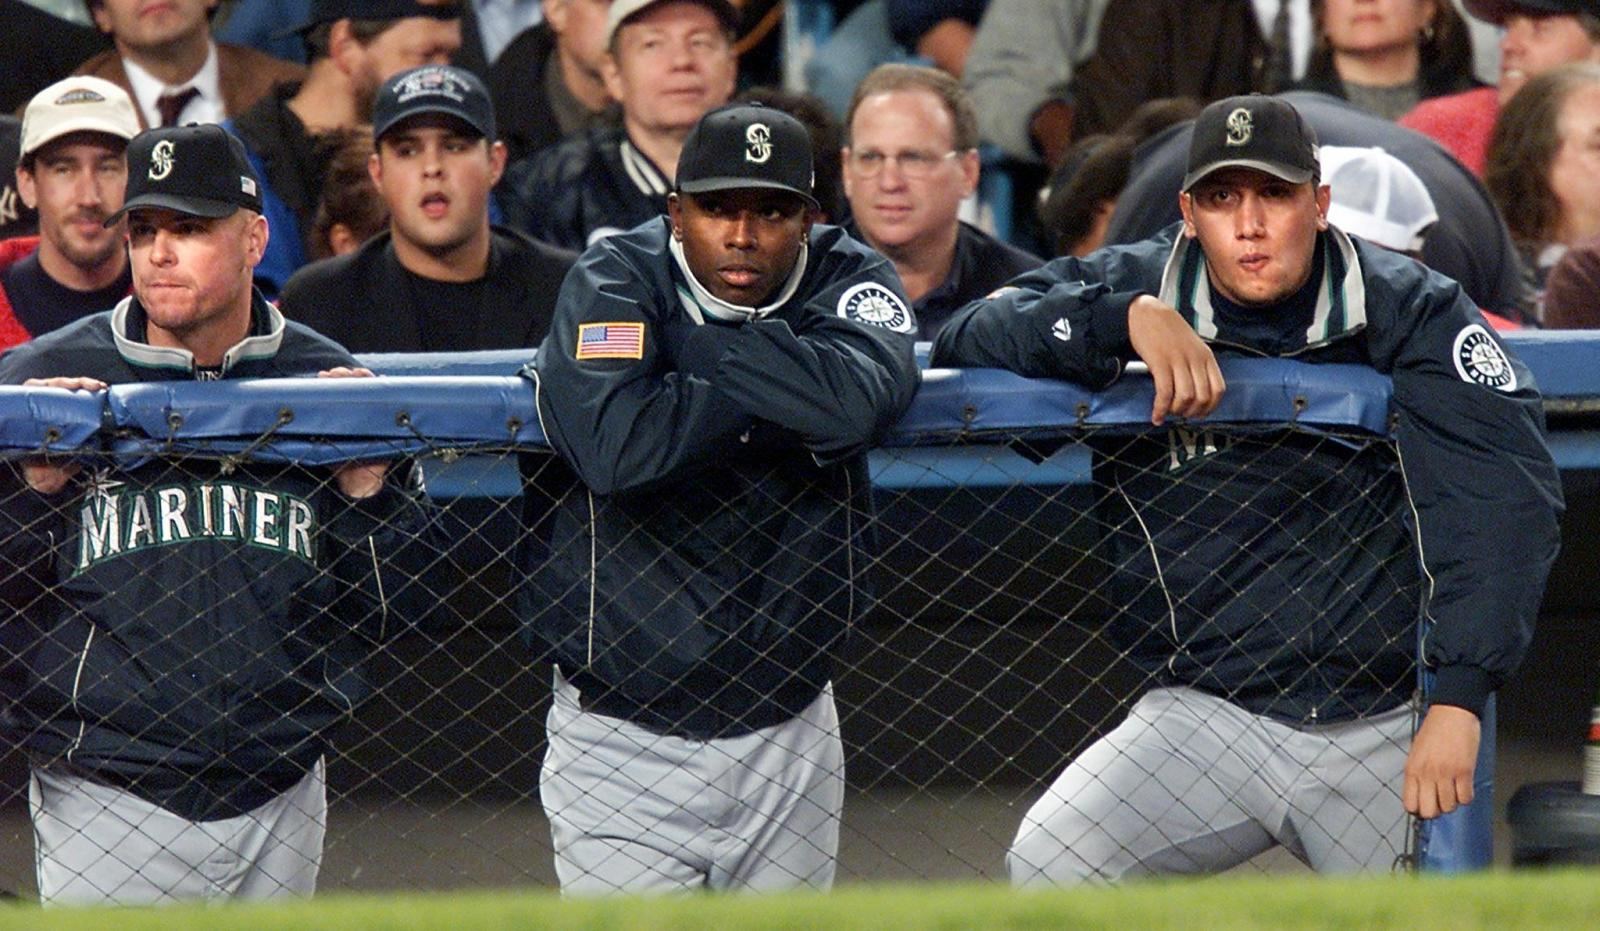
Die-hard baseball fans know this – it’s the reason the “best” team often doesn’t win the championship, despite a best-of-7, multiple round playoff format. Think about the 2001 Seattle Mariners, who went 116-46 for the best regular-season record in the modern era, but then didn’t even make it to the World Series.
Naturally, in a sport like this, it can be hard to parse apart the luck from the skill, especially in small sample sizes. Going 4-4 with 4 bloop singles is a whole lot “better” than going 0-4 with 4 350-feet lineouts, even if the guy who went 0-4 likely had a more “skillful” performance that day. For almost all of baseball history, it was generally accepted that these types of idiosyncrasies tended to balance themselves out over the course of a massive 162-game sample size. Willie Keeler could never have hit over .360 for 7 years straight by relying on luck alone.
Even as baseball statistics continued to grow in both power and popularity, this paradigm held true most of the time. Whether you were looking at batting average or OPS, pitcher wins or ERA, even the “better” descriptive stats were still results-based.
That all changed with the invention of stats like FIP (fielding-independent pitching), founded by Tom Tango in the 2000s, just the beginning of a massive movement in sabermetrics to better quantify individual players’ skill. Although the formula can be intimidating, the thought process behind FIP – and all other “defense-independent” pitching stats – is simple: only account for the events within an individual pitcher’s control. For FIP, that means walks, strikeouts, and home runs. After all, once that pesky ball gets put onto that massive “goal”, the dreaded field of play, it’s all (to some extent) a crapshoot.

Although it’s still far from perfect, in many ways, FIP is a “better” stat than ERA, even though – or perhaps because – it doesn’t reflect the results themselves. For example, it’s been shown that a pitcher’s FIP is more consistent correlating far more strongly from season to season than ERA; removing the confounding variables of defense and situation make it a more distilled-down measurement of skill in a sport where there’s room for so much – well – baseball.
But perhaps the biggest paradigm shift for baseball statistics happened just within the last 10 years, with the advent of Statcast in major league ballparks in 2015. The ability to measure batted-ball exit velocity and launch angle led to a wealth of data baseball never had before – data that would literally change the way the game is played.
Forget the level swings of the past, protecting the plate and moving the runners over. More and more batters are going for exit velocity and launch angle, strikeouts be damned. Many remain skeptical, but the data (mostly) don’t lie.
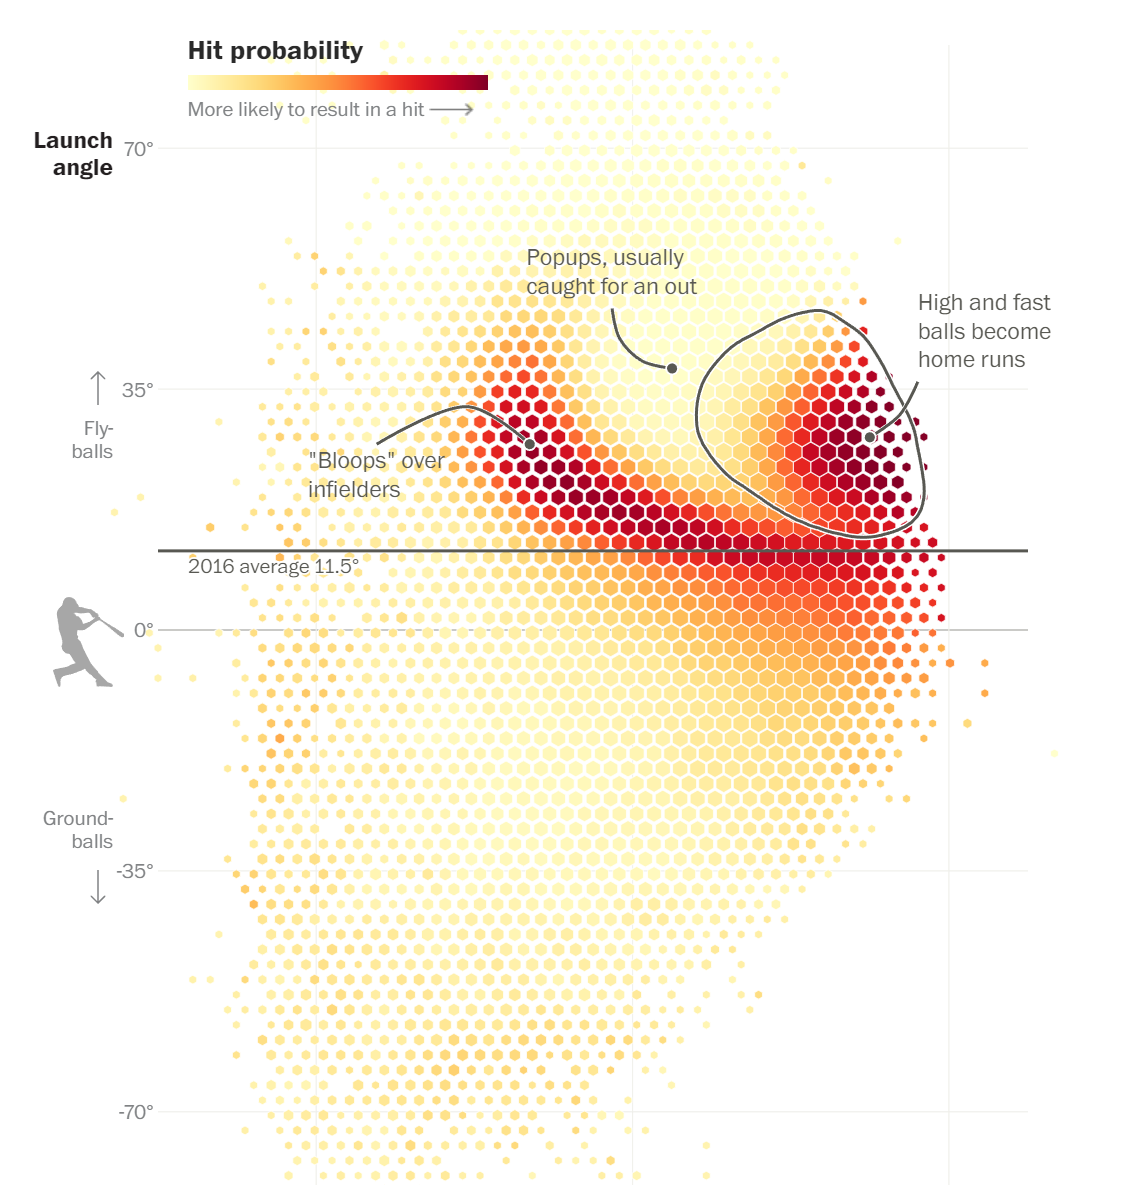
It’s not some novel concept discovered in 2015 that hitting the ball harder is generally better, as is giving yourself a chance to hit the ball over the wall. But the Statcast data – and the insights that have come from it, like the chart above – have swung the pendulums even further. In an somewhat ironic feedback loop, the “3 true outcomes” of FIP – walks, home runs, and strikeouts, have become even more “true”, as fewer and fewer batters put the ball into that big ol’ field of play,
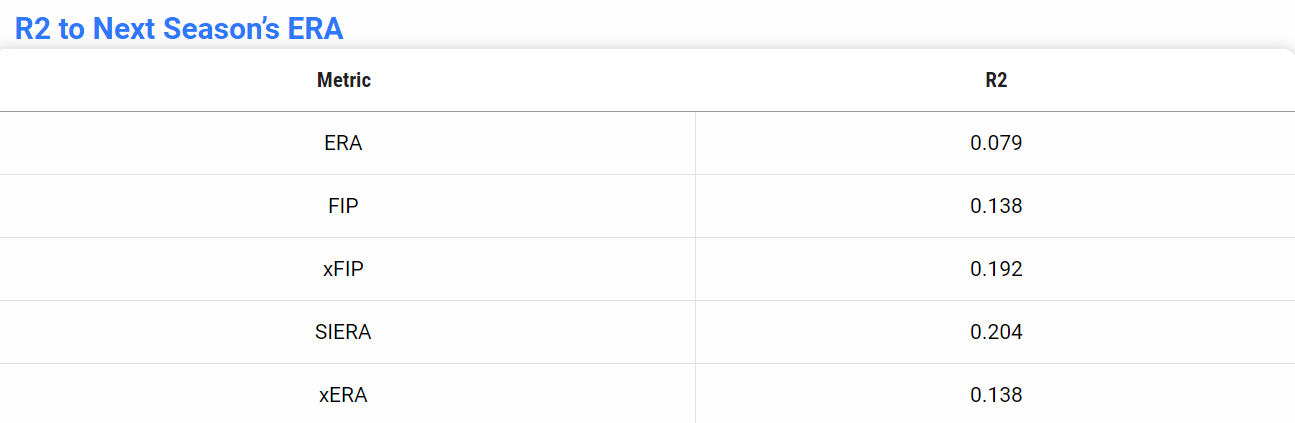
With this Statcast data come a ton of fun calculations, most notably the “expected” statistics. Given launch angle and exit velocity of a batted ball, as well as a batter’s sprint speed, we can calculate what a pitcher’s ERA “would have been” in that generalized scenario, thereby removing a lot of the “baseball” variables like fielders. And this has been good for studying pitchers’ success. It’s subtle and can feel somewhat counterintuitive, but like FIP, xERA in one season is actually more predictive of a pitcher’s ERA in the following season than their literal ERA itself.
Like many other new-age baseball statistics, these “expected” stats try to distill down the “skill” of a player out from the many crazy “real” results. And in most ways, they succeed. After all, preventing hitters from hitting the ball hard takes a lot of skill, as does preventing hitters from getting the ball in the air. However, like all stats, Statcast-expected stats are far from perfect.
What takes more skill from a pitcher – preventing a 104 MPH shot to the warning track, or an 81 MPH blooper? As baseball fans know, the latter is “better” than the former – and expected stats understand that as well, since the data knows that those bloopers are hits more often.
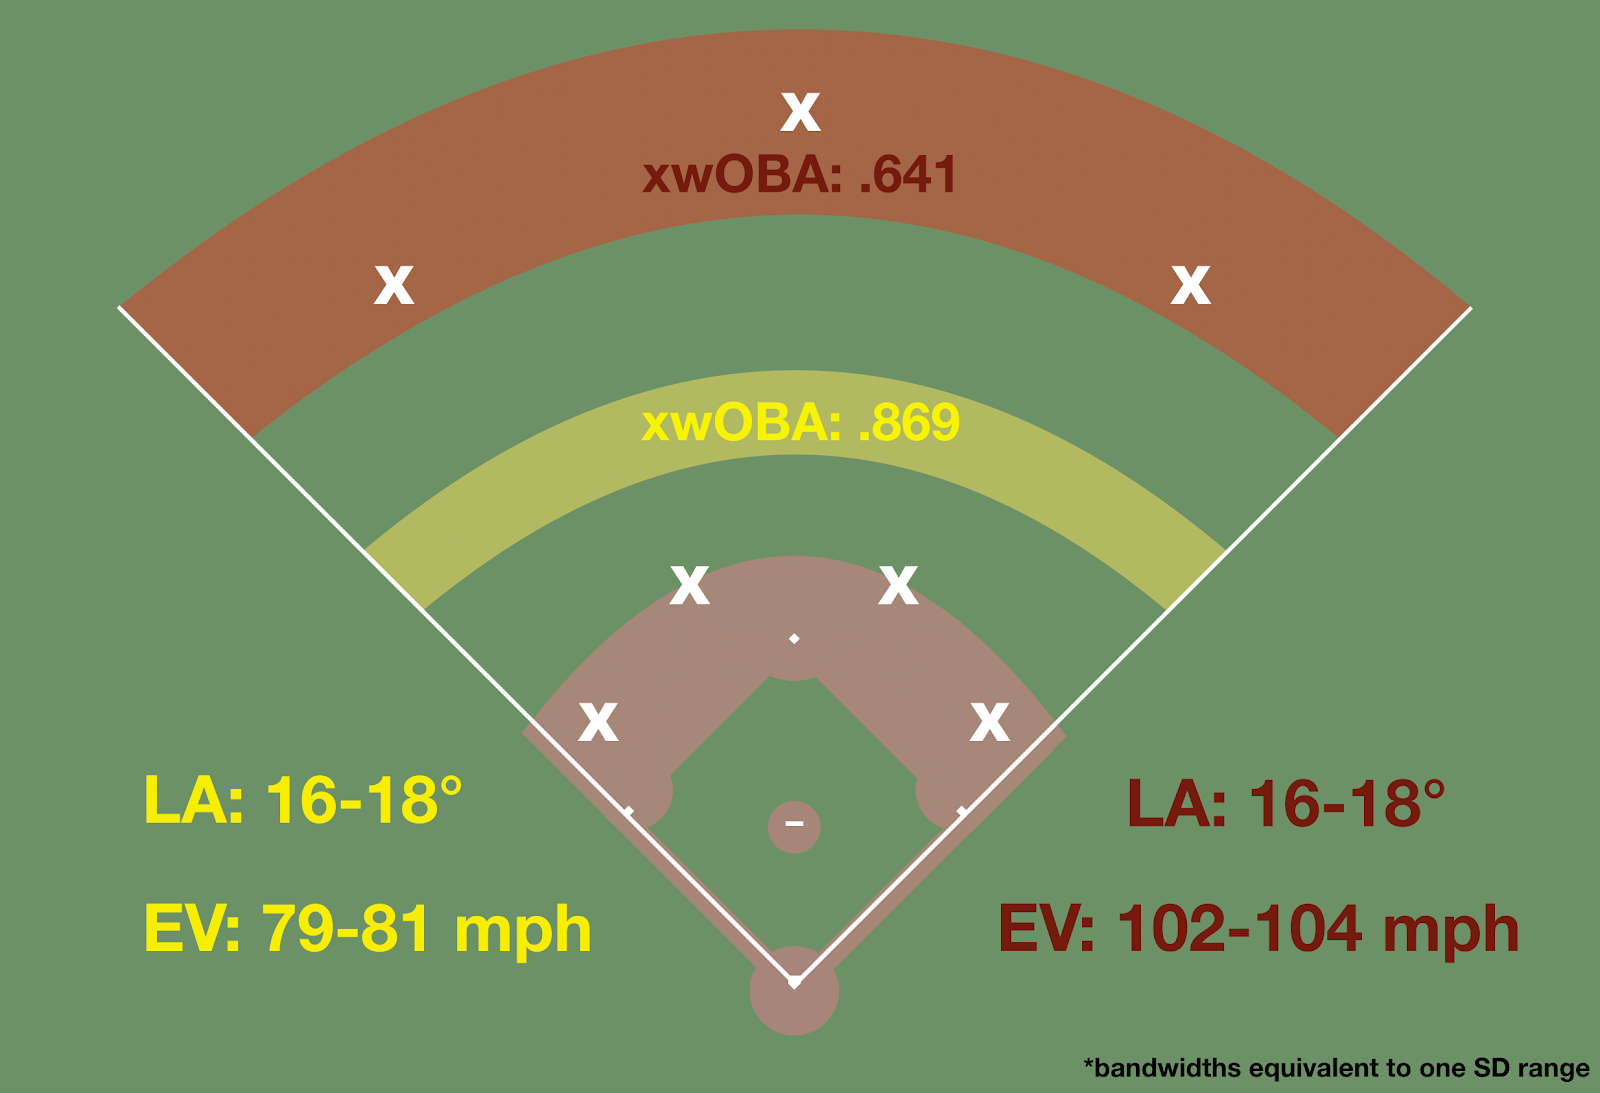
But is preventing the blooper – or hitting it – really a more repeatable “skill” that’s more predictive of future performance than the warning track shot? Of course, that’s up for interpretation. But it’s an interesting example of how expected stats can in some ways trade skill for reality – when in other ways they don’t, or at least not yet in the public domain.
How so? Of course, exit velocity and launch angle tell a huge portion of the story, but it’s a two-dimensional one. And a 2-dimensional story is extremely flawed in a sport like baseball – the wall is usually around 400 feet away from home plate, but the field of play can be more than 120,000 square feet. It would be pretty easy to catch a rogue Minnesota squirrel if it only had 2 dimensions to frolic in.
One of the biggest ways this 3rd dimension in baseball manifests itself is in the shift. Of course, if the defense knows that a player has a tendency to pull the ball in one direction, they have the right to place their defenders wherever they please in order to defend the spots a batted ball is most likely to go.
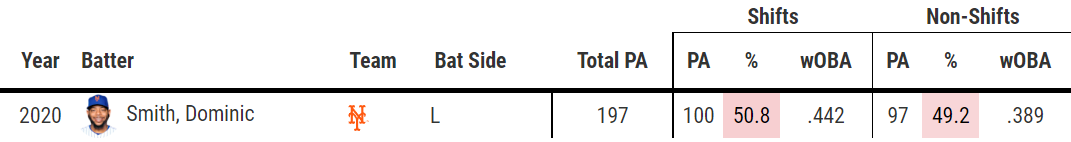
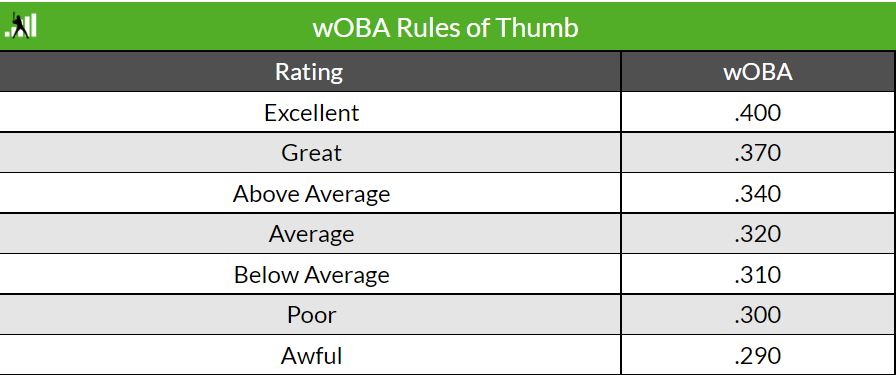
Let’s start with a case study in Dominic Smith. Smith had an unbelievable breakout year in the shortened season in 2020, hitting .316/.377/.616 for a .412 wOBA, weighted on-base average (think a version of OPS that weights more valuable plays a bit more fairly). That ranked in the 97th percentile in all of baseball. Maybe even more impressive is he did it despite the defense using shifts on him more than half the time.
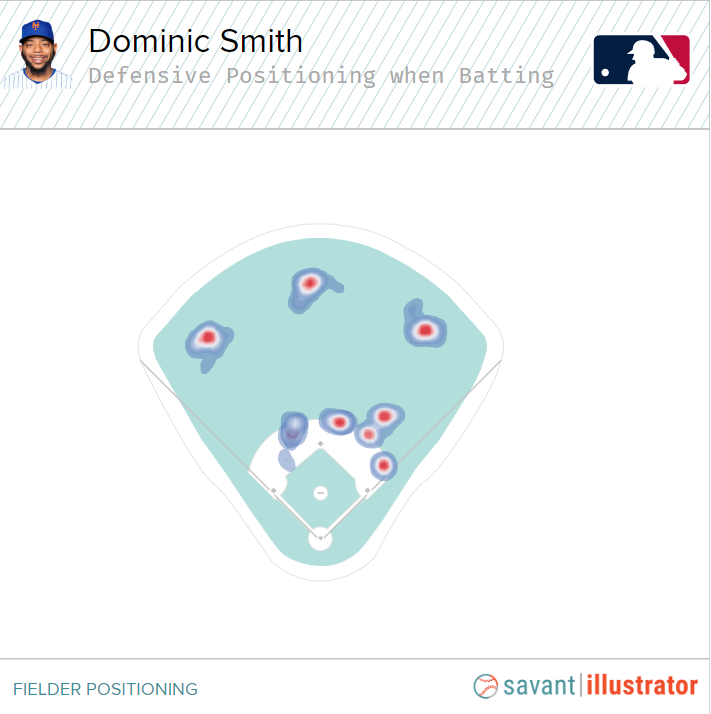
Smith had almost an entire half an infield to play with, and he made the defense pay in those situations. He had a .389 wOBA when unshifted that year, which was already quite good, but that number jumped to .442 when the defense put the shift on. If you’re having trouble putting that into context, Barry Bonds’ career wOBA was .435.
What did Statcast think of his year? Well, his .392 xwOBA – expected wOBA – was excellent, but definitely a good deal below his .412 “real” number. The implication? Based on his exit velocities and launch angles, his excellent season was better than it “should have” been. The expected stats weren’t as much of a believer in his skills, and a large part of that (not nearly all of it) likely came from how well he performed against the shift, in that 3rd dimension. When other teams gave him more of the 3rd dimension to play with, he made them pay.
Spoiler alert if you’re unfamiliar with Dominic Smith’s career thus far – he didn’t keep hitting like Barry Bonds. 2021 was nowhere near as kind to him; in a larger sample size that non-COVID year, his slash line plummeted back down to earth at .244/.304/.363. What was the shifting like? Did teams believe his 2020 shift-beating abilities were a real repeatable skill they should plan for?
Quite the opposite – he was actually shifted a good deal more in 2021 than 2020; 60% of the time!
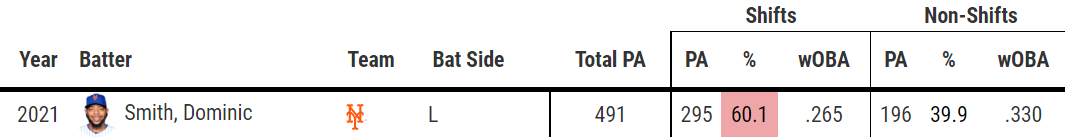
More importantly, though, look at his wOBA performance when shifted vs. unshifted – it was the complete opposite trend vs. his 2020. When the defense played Smith straight up, he still hit like an average to above-average player. When shifted? After looking like prime Barry Bonds in 2020, he was worse than awful in 2021.
Other teams essentially made the bet that his great results in 2020 were more “luck” than skill, and their bet paid off in a big way.
Over his career, Smith’s wOBA and xwOBA have obviously trended similarly, but they’ve sort of “flip-flopped” to an extent season-to-season. Since his 2017 debut, he’s had 3 years where his wOBA outperformed his xwOBA, and 3 where he underperformed.
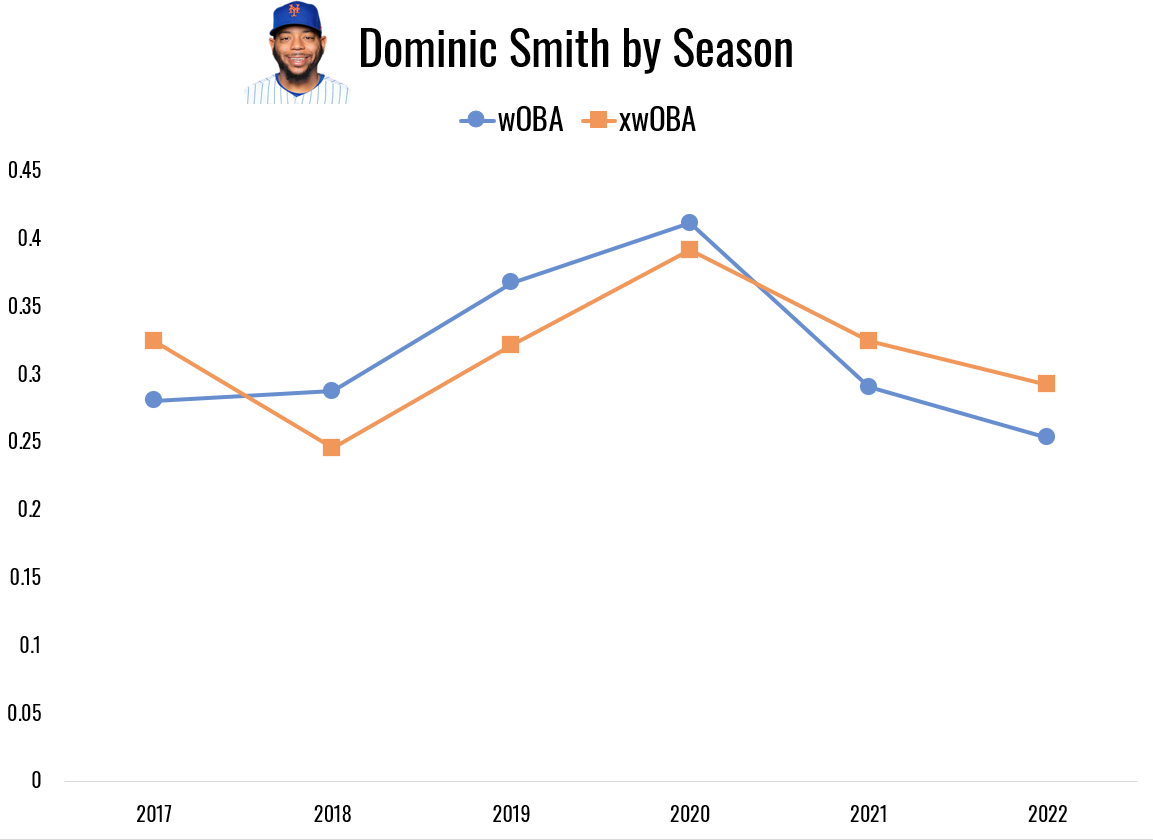
And that, by the way, reflects most of baseball. xwOBA is what it is for a reason; on a macro basis, it averages out to about the same as wOBA across baseball.
So, does that mean that at the end of the day, xwOBA really is “better” than wOBA? Or, to phrase differently, is xwOBA more predictive of future performance (wOBA) than wOBA itself is? Remember, we looked at FIP and xERA, showing that for pitchers, these stats actually correlated better statistically with future ERA than ERA itself does. What about for batters?
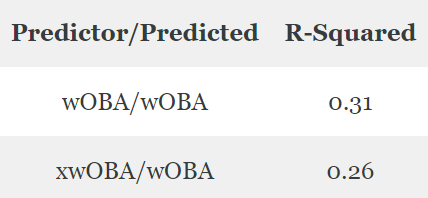
Ah-ha! The opposite occurs here; the R-Squared is higher, by a small but significant margin, for batter’s wOBA itself when comparing against next year’s wOBA. When we attempt to take defense out of the equation statistically, it’s really valuable to describe pitcher performance – but maybe not as valuable to describe batter performance.
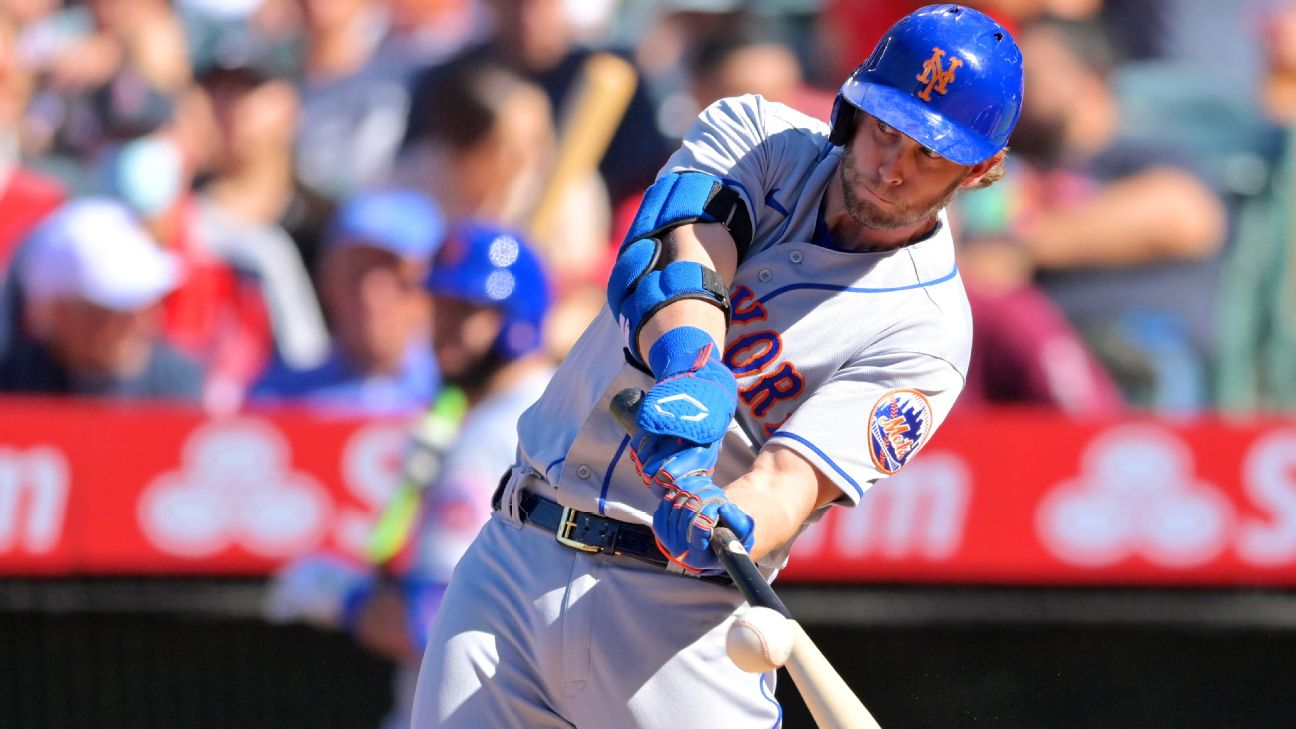
Enter Jeff McNeil. Affectionately dubbed “the flying squirrel” in college for how he threw his body around the field, the Mets’ do-it-all infielder/outfielder is the perfect example of a player who couldn’t care less about his Statcast metrics. McNeil is a slap hitter who’s never ranked above MLB average in average exit velocity in his career. His career Statcast-expected batting average (xBA) is .274 and has never exceeded .283 over a full season. Only problem is, he’s got a career batting average of .304 and has hit better than .311 in 4 of his 5 seasons.
Of course, one hypothesis is just a lot of luck. Jeff McNeil’s career batting average on balls in play (BABIP) is .331, far higher than the MLB average which usually sits around .300. By the strict exit velocity/launch angle view, outperforming “expected” results on balls in play, while almost never hitting the ball hard, should be almost impossible.
From a pure statistical perspective, though, it would have to be an unthinkable amount of luck. Not to throw you back into your college stats textbook, but a proportional t-test between his career .304 BA and his .274 xBA, based on a massive sample size of 1693 at-bats, implies essentially a 0.28% chance (0.0028 p-value) that the two proportions (batting averages) come from the same normally-distributed population. That is to say, those two numbers are almost certainly describing – or attempting to describe – completely different players.
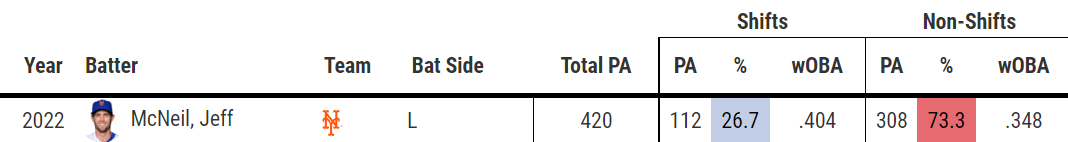
So, what’s the explanation? Let’s bring in the 3rd dimension again – Jeff’s horizontal spray chart. We can revisit shift statistics to get a pretty good , although of course somewhat incomplete, idea of how he uses the whole field. Unsurprisingly, McNeil is shifted a great deal less often than Dominic Smith, only 27% of the time this season – likely because when he is, he has the ability to make defenses pay in a big way.
It passes the eye test; McNeil’s always been known as a seeing-eye hitter who can frustrate pitchers by, well, hitting it where they ain’t.
Just take a look at McNeil’s batted ball profile when shifted vs. unshifted, and you can see a guy that’s changing his approach based on how the defense is playing him.
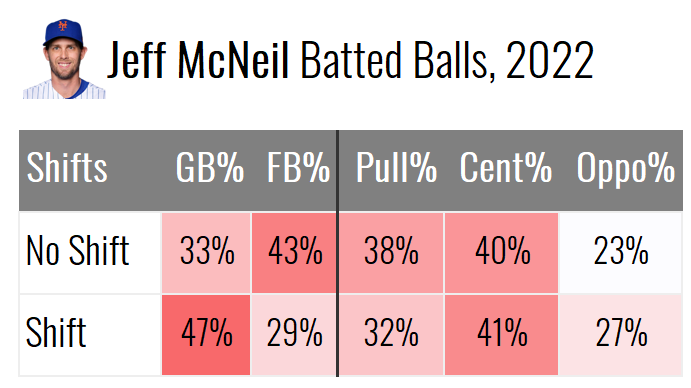
When there’s no shift, he profiles like your average lefty – pulling the ball a good deal (Pull%), and getting the ball into the air (FB%).
When the shift is on, though, he turns back into the squirrel – his ground ball rate skyrockets, and he hits the ball a good deal more to the center and opposite field.
You can even hear Mets (elite) play-by-play guy Gary Cohen, in that last clip, remark “come on, I mean, how many times does he have to do it?”. Just like our friend the Minnesota squirrel, this New York squirrel happily uses all parts of the field.
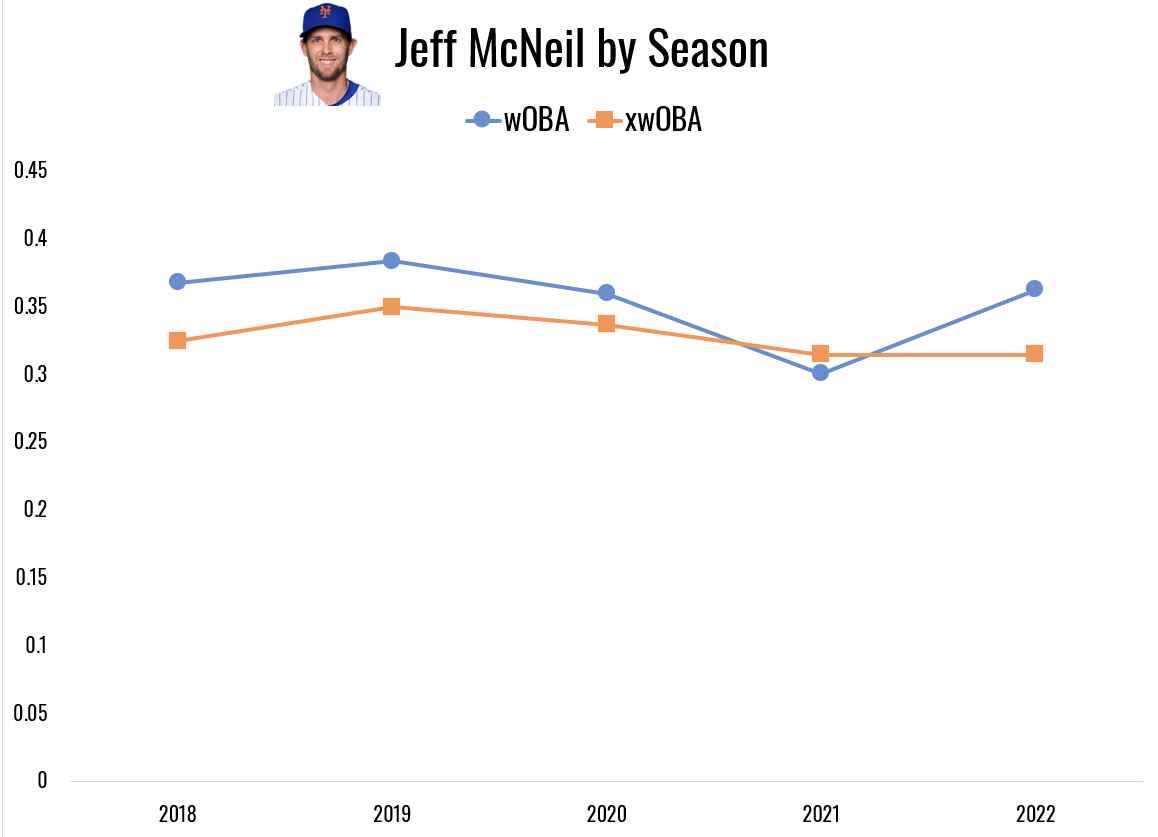
Unsurprisingly, yet starkly, outside that weird blip in 2021, McNeil has outperformed his xwOBA in every season in his career.
For Dominic Smith – and most of baseball’s hitters – xwOBA is a very useful measure of quality of contact and batter skill. But for the squirrel? That third dimension is far too valuable a variable to simply ignore and chalk up to luck.
In many ways, McNeil has been a microcosm, representative of the 2022 Mets offense as a whole. They’ve had a ton of “results” success offensively this season despite middling quality of contact. New York ranks 23rd in MLB in hard-hit rate and 19th in barrel rate. However, they rank 5th in MLB in runs per game and 5th in hits per game. With some of the weakest contact in the league, they’re among the best at getting hits when they put the ball in play; they’re 5th in BABIP, too.
That can obviously be frustrating to play against. After taking a loss to the Mets earlier this month, Atlanta Braves rookie stud pitcher Spencer Strider made headlines with the media. He remarked New York was “having a lot of luck offensively”, and, in one of the more “sabermetricsy” player answers to a media question you’ll hear, even referenced their batting average on balls in play directly: “when your BABIP is .330, .340 as a team, it’s tough to get quick innings and get quick outs.”
It makes sense that a pitcher would be using this phrasing, specifically. After all, as we saw earlier, taking the defense out of the equation actually works quite well when trying to distill down pitching skill – but not necessarily as much for batters. So, in a bizarre way, maybe Spencer Strider was a lot more unlucky in his start than the Mets were lucky.
It’s been something of a theme for New York this season. Just a couple of weeks later, Philadelphia Phillies All-Star pitcher (and former Met) Zack Wheeler had this to say after a loss to the Amazin’s:
There are a couple of variables to unpack here. First, having a high batting average on balls in play is obviously a great way to get hits, but it also helps to have a high volume of balls in play overall. Uber-simplistically, a .100 BABIP on 100 balls in play will lead to 10 hits, while a .500 BABIP on 10 balls in play will lead to just 5 hits.
And the Mets sure do put the ball in play. They’re 4th in all of MLB in avoiding strikeouts, despite seeing a lot of pitches per plate appearance. That goes a long way toward letting all that, you know, baseball happen.
Plus, as we just saw with Jeff McNeil, some guys are demonstrably better at making baseball happen than others, once they do eventually get that ball onto the field.
(Note that “DIPS” refers to Defense-Independent Pitching Stats, like FIP and xERA)
So, have the Mets bucked the trend? Have they broken or disproved expected statistics?
Of course not. Hitting the ball hard and getting launch angle works, period. The Mets are 5th in baseball in runs per game, but the top 3 teams – the Los Angeles Dodgers, New York Yankees, and Braves – rank 4th, 3rd, and 2nd in hard-hit rate respectively. They’re 2nd, 1st, and 4th in xwOBA. Crushing the ball in the air is probably the most dependable way to score runs, and relying on horizontal ball placement is in most cases an unsustainable way to build a successful offense.
But if anything, that shouldn’t invalidate what the Mets are doing offensively – on the contrary, it might make it even more impressive. For fans of the game, it’s nice to see a team doing things a bit differently, and good enough at it to still sustainably put up runs. More variety in successful offensive styles can only add to the enjoyment of the game as fans.
After all, what’s baseball if you take all of the baseball out of it?
by Derek Reifer, Northwestern University
follow Derek on Twitter @d_reif
follow Mets Analytics on Twitter @MetsAnalytics
follow Corner Three on Twitter @corner3sports
