
All MLB pitchers were starters at one point in their careers.
Growing up through Little League, college, and the Minor Leagues, anyone who is eventually good enough to pitch in the majors was likely the superstar ace of most of their previous teams. However, at the highest of levels, many pitchers have to make concessions to their new reality – the fact that they may be better served – and better serve their teams – coming out of the bullpen as relievers.
In this study, we looked to identify the best candidates leaguewide for “making the switch”: who would provide (and be provided) the most competitive advantage from undergoing the sometimes ego-shrinking change of moving to the pen?
Our study was inspired by a 2017 Fangraphs article centered around New Rochelle native Tom Koehler, who was signed by the Dodgers after a brutal 2017 season that saw a near-7 ERA, as a bet on his potential effectiveness as a reliever. It unfortunately didn’t end up working out for Koehler specifically – he announced his retirement in March 2020 after not pitching in the majors since that fateful 2017 – but the idea of scaling up that case study to an MLB-wide model could uncover some interesting insights.
Our hypothetical client is the New York Mets, though any team would be able to derive valuable information from our analysis. Knowing which players would benefit the most from a role change isn’t just valuable for the players on our roster, but others’ as well – who would be best to pursue below market value in free agency? Who might be a trade candidate on a team that only thinks of them as a mediocre starter?
Literature Review and Methods
This analysis was based on data from Sean Lahman’s online baseball database, which was able to provide historical data going back to 2003 for pitchers who had switched from starter to reliever during their careers. We were able to pull these databases down using SQL, giving us a list of 97 historical cases, each with their own respective statistics before and after their role change.
Using these historical data, we then created models to predict potential future results for current starters. The 4 metrics we chose to include in our models were:
- ERA: Perhaps the most recognizable pitching statistic in baseball, ERA provides us valuable (and easily understandable) information about how well a pitcher prevented runs, though it can be “noisy” due to its reliance on defense and “earned run” rule thresholds. In order to add robustness to our model, we decided to additionally utilize the “three true outcomes”, which exist mostly independently of team defense (as follows)
- K/9: A measure of strikeouts per nine innings, the first of the three true outcomes is often considered to be the most important metric to measure reliever success – how well can a guy come into the game and sit down his opponent? If you’re entering a bases loaded situation, earned runs are irrelevant; quick outs, without the ball in play, are paramount.
- BB/9: Just as strikeouts are important in their transferability across situation, walks, the second true outcome, leave very little up to interpretation. We don’t want to be giving up free baserunners, especially when a pitcher is coming off the bench and fatigue is less likely to be an issue.
- HR/9: The third true outcome, home runs are a function of multiple different pitching skills, including ability to prevent contact and ability to prevent hard contact. Though there can be minor inconsistencies including differing ballpark dimensions, home run prevention stands as a clearly robust measure of pitching success.
With our 4 metrics broken out by each pitcher both as a starter and subsequently as a reliever, we were then able to build models in R to use for future predictions. Using linear regressions, we quantified the ability of each of these 4 “before” metrics on predicting each of the 4 “after” metrics. Based on these model coefficients, we could then make projections for current starting pitchers, and how they would fare as relievers, based on their 2019 statistics.
For our sample, we selected only starting pitchers in 2019 who had thrown at least 100 innings (about 20 starts over the course of the season). We didn’t want to run into any small sample size (in terms of the innings by pitcher) issues by including pitchers who had really only participated in half of the season or less, while we also didn’t want to parse down our sample so small that we were only really getting the elite guys who had compiled far more innings than the average starter (as most of those pitchers would simply not be more useful as relievers regardless of the model results).
Results
We definitely needed to account for the fact that yes, guys like back-to-back Cy Young winner Jacob deGrom would likely be elite relievers, but don’t necessarily provide excess value there. Our method was to utilize a system based on percentiles to figure out which guys are really missing out on some extra competitive advantage. For example, if a pitcher who’s a 50th percentile starter in K/9 projects to be 98th percentile in K/9 as a reliever, that could be a red flag that his game might be better suited for the pen. Looking at this difference, as opposed to simply the “as reliever” projections themselves, allow us to isolate the impact of the potential switch itself.
This system lets us systematically isolate which pitchers have the largest discrepancies between their current starting pitching performance and their expected reliever performance, eventually getting us to a select group of candidates. To create our “top 10” lists, we compiled the pitchers who had the biggest difference (positive or negative, depending on which was meaningful for the specific metric) between their percentiles as starting pitchers in 2019 and the model-projected percentiles as relievers in the hypothetical future.
First, the top 10 before/after percentile discrepancies for ERA, representing the 10 guys seeing the most significant positive change in the model after switching to the bullpen. The players are organized by the size of the percentile discrepancies, and the separate percentiles are shown:
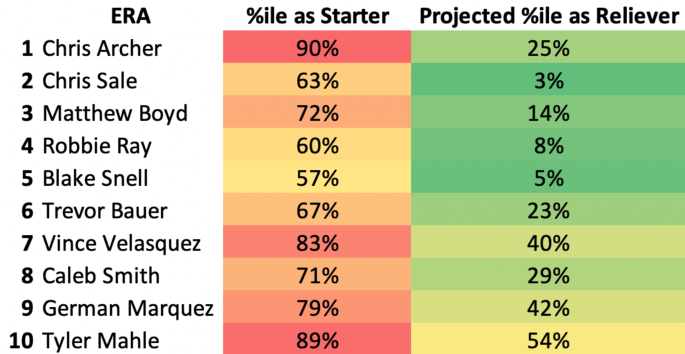
Chris Archer was someone we had actually discussed before the analysis as a potential candidate for “the switch”, so it was fascinating to see him show up first on this list. A guy who had immediate success as a rookie, showing high talent level, but who has struggled in his more recent seasons, could certainly benefit from even just a change of scenery.
Other fascinating cases include Chris Sale and Blake Snell – two guys that are still widely regarded as superstars but had poor 2019 ERAs, it would be surprising to see either make an immediate switch, but they could be candidates to keep an eye on in the coming seasons.
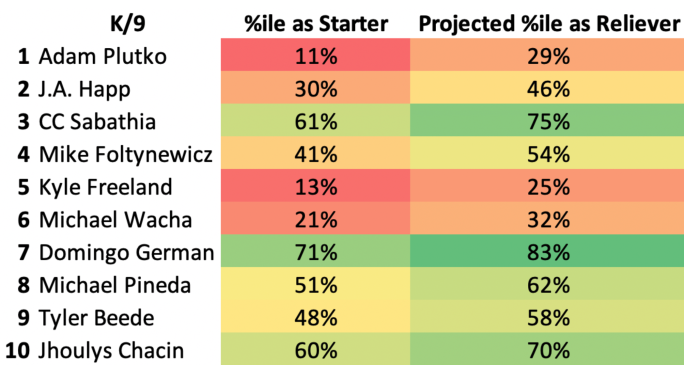
Strikeouts per nine are debatably the most important indicator for a good relief pitcher, and the model uncovers plenty of potential candidates. Adam Plutko struggled with under 7 strikeouts per nine as a starter in 2019, but our model projects him striking out 9.42 out of the pen. J.A. Happ drew the ire of Yankees fans this past season for his poor performance, but a switch in role could have him looking downright average!
Meanwhile, just-signed New York Met Michael Wacha was already a buy-low signing this past offseason, but perhaps he’s not the best candidate to replace injured Noah Syndergaard in the rotation after all, with a significant projected improvement as a reliever.
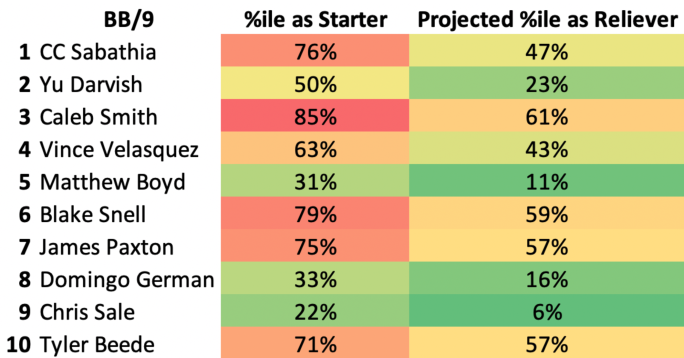
Walks and strikeouts often go hand in hand, and we can see now-retired CC Sabathia showing up again as a top candidate.
Additionally, it’s not surprising to see tough lefties like Blake Snell, James Paxton, and Chris Sale (again) project as elite relievers, however unlikely the switch might be at this juncture. However, the sheer size of the difference for Yu Darvish, whose walk prevention is projected to go from mediocre to borderline-elite, is certainly an eyebrow raiser.
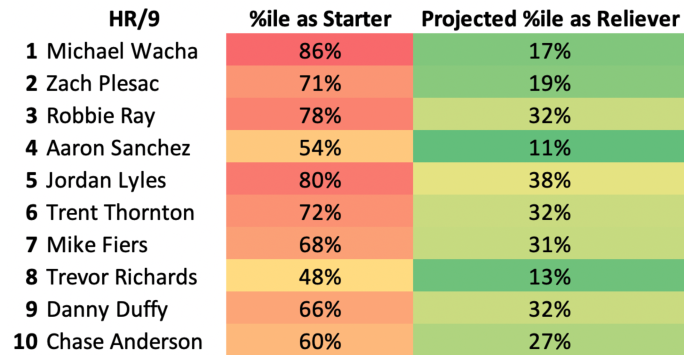
Home run prevention has seen some of the biggest shifts in our entire analysis. Michael Wacha, who allowed over 1.7 homers per nine innings in 2019, would be expected to allow under 1 (0.97) if he were to make the switch, nearly a 50% decrease in home run rate! Meanwhile, Aaron Sanchez and Trevor Richards, who had relatively solid years preventing the longball, are expected to be downright elite out of the bullpen per our model, nearly cracking the top tenth of our dataset after the switch.
Conclusions/Recommendations
So, how can the Mets best use this information?
The first, (potentially) obvious step is to experiment with bringing Michael Wacha out of the bullpen. The recent signing ranked 6th in our model for BB/9 improvement, and 1st in HR/9 improvement – it’s clear he has a significant chance to outperform his new contract in a different role. In terms of his replacement in the rotation, guys like Seth Lugo and Robert Gsellman, who have seen past success as starters, could be potential internal candidates.
Outside of the organization, there are plenty of potential targets, but some prime examples from this analysis would be Aaron Sanchez, Vince Velasquez, and Tyler Mahle – pitchers who have not been quality starters of late, and whose teams might be willing to part with them for pennies on the dollar. Betting on someone to be a quality reliever when they have no major league examples as a reliever can be scary, but this analysis provides evidence that they might be worthy bets for the right value.
“All models are wrong, but some are better than others”. As with any linear regression analysis, there were limitations in our study as we look to reflect reality as well as possible. These potential pitfalls include noise within our metrics (especially ERA) and a relatively limited dataset (97 pitchers available in our historical database). In an effort to assuage the first pitfall, we initially hoped to analyze even more robust metrics, such as WHIFF percentage and average fastball velocity, but realized this would only exacerbate our second pitfall, as those data were more spotty and would require significant imputations (and thereby multicollinearity) for our models.
Future research, as always, would be recommended. If the team can access more robust data (and more data in general) in this vein, it would be extremely helpful to build on this analysis. Potential partnerships, including with Statcast/PitchFX, or perhaps through proprietary tracking methods, could yield a significantly larger dataset in terms of both breadth and depth with which to conduct statistical modeling.
by Justin Halpern & Derek Reifer, Northwestern University
connect with Justin on LinkedIn Justin Halpern
follow Derek on Twitter @d_reif
follow Corner Three on Twitter @corner3sports

Kansas City has found success with this transition as of late as they molded Wade Davis and Ian Kennedy to be solid relievers after struggles in the rotation. A candidate to watch in KC could be Jesse Hahn who doesn’t have a lot of data due to recovery from arm issues the past couple of years but he has high velocity stuff and kept the ball on the ground and had good k/bb ratios in Oakland as a starter.
LikeLike