
The managers of MLB seem to have it down to an art.
- 1st: Speedy guy who can steal bases.
- 2nd: Guy who can drop a bunt or draw a walk.
- 3rd: Your best pure hitter.
- 4th: Cleanup man; your best power hitter.
- 5th: Complete the “heart” of the order; a good power hitter.
- 6th-8th: Your remaining position players, in descending order of quality.
- 9th (NL): Your pitcher.
Unfortunately, the conventional batting order is nothing but tradition, and no one ever seems to question this idea that’s been around for more than a century. Have you considered that this isn’t actually the optimal lineup to win more baseball games (score as many runs as possible)? Many sabermetric studies have looked to find the truly optimal batting order, based mostly on the two most important hitting stats: OBP (on-base percentage) and SLG (slugging percentage). Both of these stats, based on regression modeling, have much higher correlations to runs scored than BA (batting average), which is conventionally the main statistic used to measure the quality of a hitter – once again, an archaic tradition that the game of baseball has unfortunately been resistant to changing. A higher correlation, in non-statistical terms, means that a team that has a higher OBP or SLG will most likely have more wins over the course of a season than a team that just has a higher BA.
The leveraged out
Back to the batting order – studies have striven to find many different tidbits about lineups that would lead to optimization. One method, as written by Sky Kalkman in Beyond the Box Score, is the importance of avoiding outs for each player in the lineup. Basically, over the course of a season, which spots in the lineup are most crucial to winning in terms of OBP? Which spot’s OBP has the biggest effect on a team’s 162-game success? Here’s a section from his study:
“Another way to look at things is to order the batting slots by the leveraged value of the out. In plain English (sort of), we want to know how costly making an out is by each lineup position, based on the base-out situations they most often find themselves in, and then weighted by how often each lineup spot comes to the plate. Here’s how the lineup spots rank in the importance of avoiding outs: #1, #4, #2, #5, #3, #6, #7, #8, #9”
According to Kalkman’s study, you should put your hitters in the specified order, based on descending value of OBP. Because the first batter’s OBP has the greatest effect on your team’s total runs, then fourth, then second, etc., ordering your lineup in such a way would be a big step up from just generalizing and using traditional methods. To explain the concept further, and to show one way in which managers have failed to give their teams the best chance to win, Bill Petti of FanGraphs developed the following heat map graphic (darker green meaning higher OBP, and darker red meaning lower OBP):
 Clearly, for the majority of the past forty years, managers have been putting the player with the greatest ability to get on base in the spot that ranks fifth in importance, in terms of OBP. Vice versa, in the most important spot for a high OBP, managers have tended to, on average, put their third or fourth best player at getting on base. As a baseball fan, facts like this truly disappoint me. And although the leveraged out is one way of optimizing a lineup, there are additional important studies to consider when crafting your most successful lineup – which MLB managers also seem to ignore.
Lesson: bat your highest OBP player first, while generally following Kalkman’s list the rest of the way, in order to avoid more costly outs over the course of the season.
Run-scoring potential
The most important thing to do on offense in baseball is to score runs. So why not continue to optimize our lineup to allow us the best chance of scoring the most runs? TangoTiger has developed a run expectancy matrix – predicting the number of runs scored in each of 24 possible situations based on the occupancy of the bases and the number of outs. The data was taken over a span of (coincidentally) 24 years. What did it find?
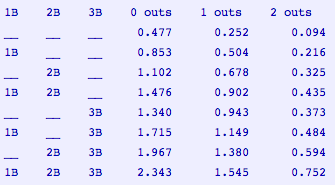
The matrix has an x-axis of the number of outs, and a y-axis of the baserunner setup. Each of the decimal numbers represents the expected number of runs scored from that point on in the inning. For example, with the bases empty and nobody out, there is a base run expectancy of .477. What does this matrix tell us? For one, it shows that, in general, sacrifice bunts – a conventional-wisdom baseball tactic – are generally not smart. A man on first with no one out gives you a higher run expectancy than a man on second with one out, and so on. There are other similarly interesting facts hidden in the matrix as well, but we want to see how it affects our optimal batting order.
According to Keith Law at ESPN, we can consider the number of plate appearances each lineup spot receives, as well as the frequency with which each lineup spot gets each base-out situation (vertex in the matrix) to actually discern which spots in the lineup have the most value in terms of run-scoring over the course of the season. In other words, we are looking for the spot in the lineup that has the potential to produce the most runs by performing well. Which lineup spot is that? The research doesn’t say third, but second – the spot that as recently as 2012 was given to each team’s sixth best player at not getting out according to the aforementioned heat map graphic. How can so many teams be willing to hurt their chances of winning by not looking at the facts?
Lesson: bat your best overall hitter – perhaps the one with the highest OPS (OBP plus SLG) or SLG – second in order to drive in more runs over the course of a season.
The myth of the stolen base
One of the most well-known lineup rules is that the top spot in the order (and many times the second spot as well) belongs to speedsters who can steal bases and make things happen on the base paths. However, managers never actually consider when stolen bases are most valuable.
Consider this simple thought experiment – why do players with the ability to advance bases on their own bat directly in front of the team’s most skilled hitters? If your base-stealer gets on base right before your guys who can produce extra-base hits most often, is he getting his full value? A home run from your best power hitter will knock in baserunners no matter which base they’re on, while a single from a less polished hitter won’t get you a run unless there are baserunners in scoring position. The weaker batters toward the end of the lineup are actually the ones that need help driving in runs.
Here’s just one example – Dodgers shortstop Dee Gordon currently leads MLB with 46 stolen bases, and manager Don Mattingly therefore bats him leadoff. But he’s probably not the right choice for that spot, as he’s oscillated between 3rd, 4th, and 5th in OBP among the team’s starters this season (we learned earlier that your best player at getting on base should lead off). Additionally, the players that follow him in the lineup – usually Yasiel Puig, Adrian Gonzalez, and Hanley Ramirez – sport the three best slugging percentages on the Dodgers! Clearly, that trio has the ability to produce extra base hits and knock Gordon in themselves, without him risking an out for second base – a tradeoff that the run expectancy matrix has already told us is fruitless. The most common 7th and 8th batters on the Dodgers, Juan Uribe and A.J. Ellis, have the 7th and 20th highest SLG, respectively, on the team, and Ellis is followed in the lineup by the pitcher, likely the team’s worst hitter. Don Mattingly would probably cringe if he knew how many runs his shortstop could have scored on singles from Uribe and Ellis, runs that were never scored, and how many times his shortstop risked an out (or actually got out) stealing second or third, only to be driven in by a Puig or Gonzalez bomb. Hopefully soon, data will surface that will actually show managers like Mattingly exactly how many runs they’ve given up this way
Lesson: in the 5th-6th-7th area of the lineup, bat competent base stealers who can give your weaker hitters opportunities to drive in runs.
So, let’s revisit the batting order and see how managers could actually be pulling their weight in the W/L column.
- 1st: Your player who’s best at not getting out – a high OBP means more reaching base and more run scoring. Speed is an advantage, but a slow player that can draw walks is better than a recklessly swinging burner.
- 2nd: Your player with the best ability to drive in runs – weighted situations say that putting your best OPS/SLG batter in this slot will lead to the most total runs for a team over the course of the season.
- 3rd: One of your middle-of-the-pack hitters – not only is this slot fifth out of nine in terms of most important OBP, but it’s second only to the leadoff spot in terms of plate appearances with the bases empty. The spot conventionally reserved for one of your best RBI guys will have few chances to actually get them!
- 4th: After your best base-reacher and best overall slugger, your third best hitter should bat cleanup, where reaching base will be very valuable and a high slugging percentage will still provide ample opportunity to drive in baserunners.
- 5th-9th: Starting with middle-of-the-pack guys that are comparable to your number three hitter, put the rest of your hitters in descending order of quality, as those lower in the lineup will receive fewer plate appearances over time and therefore hurt the team effort less. Put players with the ability to steal bases in the earlier slots here to maximize run-scoring potential.
There is much more work to be done – and much work currently being done – in terms of creating the perfect batting order. However, there is already much concrete statistical evidence, including leveraged outs, run expectancy, base-out situations, and run-scoring potential, that show that the lineup makers are truly failing both their teams and their fans by not providing better strategies by which to win baseball games. Now, the matter becomes when the league will open its eyes.
by Derek Reifer, Northwestern University

Great article, keep it up–I really enjoyed reading it.
LikeLike
Thank you very much! More coming soon!
LikeLike
Great article, keep them coming–I really enjoyed reading it.
LikeLike
Nice article. Probably more work put into it than a baseball game!
LikeLike
Johnny.
LikeLike
This seems like a good start. I completely agree that line-ups are far from optimized. But these studies seem quite incomplete at this point. For instance, what about the pressure a base stealer has on the pitcher? Does having that speedster on first result in a less focused/less accurate pitcher, one more likely to throw a fastball or to make a mistake? Could it be that a few of the bombs Puig/Ramirez/Gonzalez hit were because the pitcher made a mistake after being distracted or frustrated by Gordon, or grooved a fastball in order to prevent Gordon from stealing? These are basic concepts, yet this article does’t address them at all. Maybe they are false assumptions, but they should be researched before conclusions are drawn. If they are true, would it be better to have that pressure on the pitcher with weaker hitters at the plate? Maybe, but where are the numbers to back it up?
Also, these studies have been done based on the old line-up conventions. Using a different line-up style will result in different data and therefore different conclusions. For example, you state that the #3 hitter has the second most at bats with no one on base and is therefore a less valuable slot. But doesn’t it make sense that if you put your two highest OBP players in front of the number three slot, this will no longer be true? Doesn’t making this one change negate the data you have which suggests other changes? As with a science experiment, if you change multiple variables between trials, you don’t know which of the new results are due to which changes made.
LikeLike
Hi mrboma, thanks for the read and the insightful comment!
In regards to the baserunners putting pressure on the pitchers, the effect has been shown to be very marginal and almost useless (see the argument in Baseball by the Numbers, starting on page 115: http://books.google.com/books?id=VsmnfVUKJskC&printsec=frontcover#v=onepage&q&f=false).
For your second question, you have an excellent point. Some of this data could change. Of course, the only way to find out more is by amassing more data. Hopefully, managers will eventually take a statistical approach to creating their lineups, and we’ll learn more.
LikeLike
Very extensive, very interesting. Do you think taking into account how the game was played in time periods would change the numbers at all? Ie, in the 60s/70s, stolen bases were very important, but today the emphasis is more HRs, less stealing (players don’t want to be injured).
LikeLike
Thanks for reading! And of course, the game has changed over time. But with many years of data, mostly recently, we can amass a large sample size that promises to give us very accurate predictors.
LikeLike
“According to Keith Law at ESPN, we can consider the number of plate appearances each lineup spot receives, as well as the frequency with which each lineup spot gets each base-out situation (vertex in the matrix) to actually discern which spots in the lineup have the most value in terms of run-scoring over the course of the season.”
Is the frequency with which each lineup spot getting each base-out situation calculated by past data? If so, it’s based on not the high OBP guy being lead-off, but a quick guy. Which skews the stats significantly. Interested in if or how you accounted for that.
LikeLike
Hi John, it’s calculated by past data, but I’m a bit confused about your question. What about a quick guy leading off would skew the stats?
LikeLike